Background
Urban road transport is remarkably inefficient. Average traffic speeds in London are 7.4mph (11.9km/h) [1] – slower than they were in the days of the horse and cart. The costs to run and fuel a vehicle are at an all-time high, even though most car journeys in the city would be quicker if you ran. Still, CO2 and NOx emissions, traffic deaths and injuries from urban road transport are staggeringly large.
A link to a more comprehensive paper detailing this work can be found at the bottom of this page. The following sections detail the key results of this investigation.
Results
An innovative approach was used to model the effect of maximum vehicle speeds in typical urban traffic. This was validated against experimental data and found to be a good representation of London traffic. For more details on the model see the model summary section below. We found that higher peak vehicle speeds (the maximum speed reached by vehicles in between junctions) adversely affected CO2 and NOx emissions, while having only a small effect on total journey times. The impact of different driving styles, vehicle size, and fuel type were also investigated and found to impact the results.
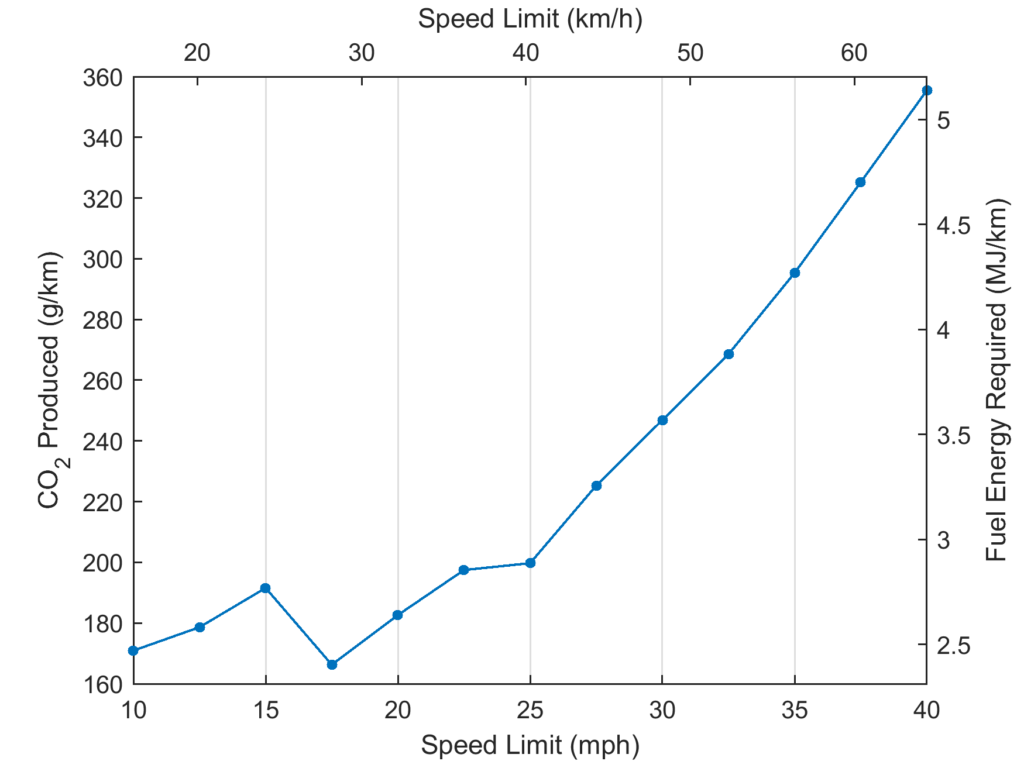
The effect of maximum speed on CO2 and NOx emissions were substantial. The emissions were dominated by the energy required to accelerate the vehicle in stop-start traffic. This contrasts to many of the accepted models in the literature, which exclude the effect of stop-start traffic and consider only the ‘cruise’ portion of the journey.
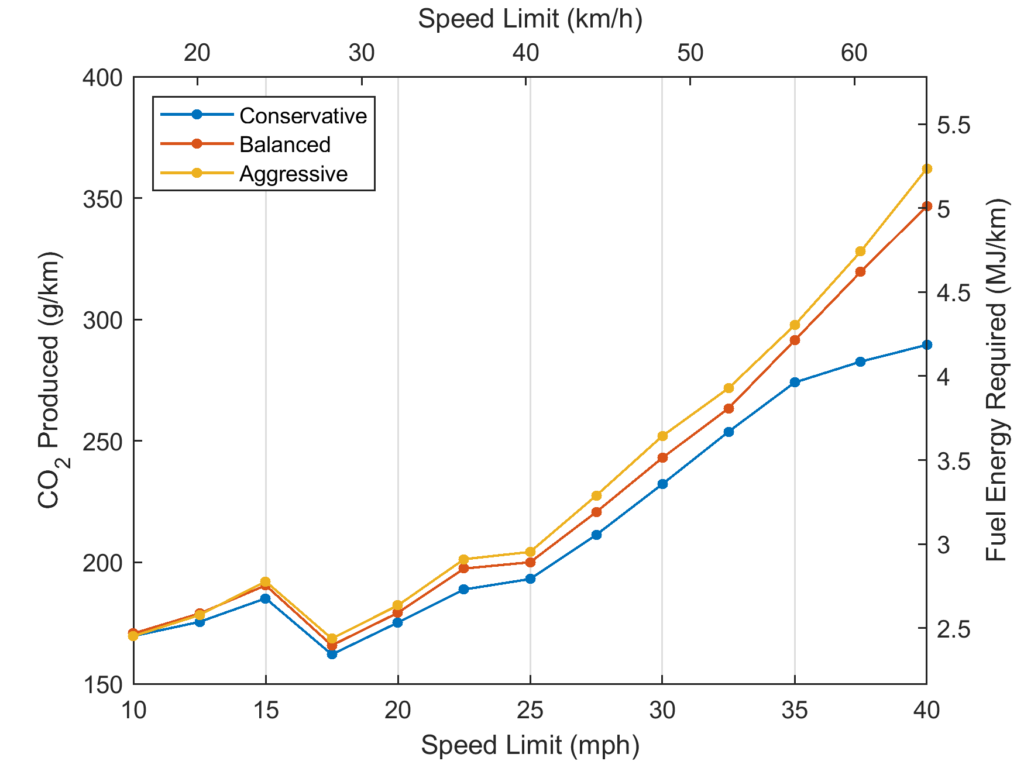
CO2 emissions were found to be significantly impacted by a change in speed limit. For a small hatchback, at a speed limit of 30mph (48.3km/h) CO2 emissions were found to be 29% greater than at a speed limit of 15mph (24.1km/h), and 35% greater than at 20mph (32.3km/h). For a diesel SUV, CO2 emissions are 54% higher at a speed limit of 30mph than at 15mph, and 38% higher than at 20mph.
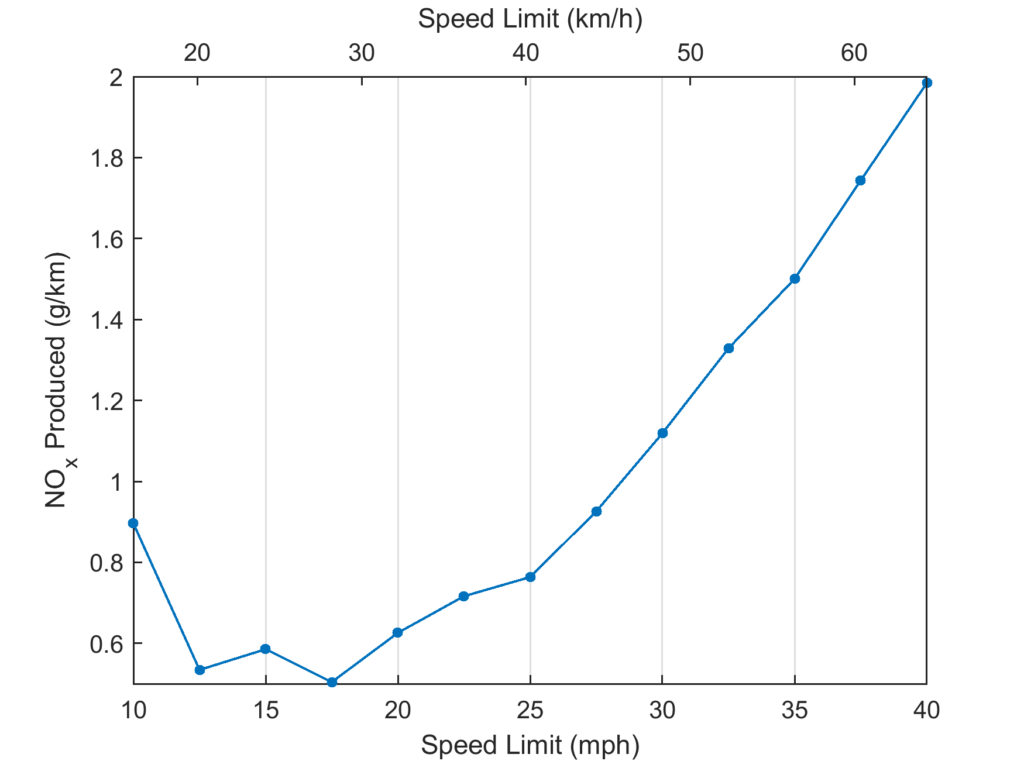
The optimum speed limit in city traffic for minimising CO2 emissions for a small petrol hatchback is around 17.5mph (28.2km/h), and for minimising NOx it is around 12.5mph (20.1km/h). For larger vehicles, diesels and SUVs, CO2 emissions are minimised at a maximum speed of 12.5mph.
NOx emissions were also found to be significantly impacted by a change in speed limit. At a speed limit of 30mph NOx emissions were found to be 91% greater than at a speed limit of 15mph, and 79% greater than at 20mph.
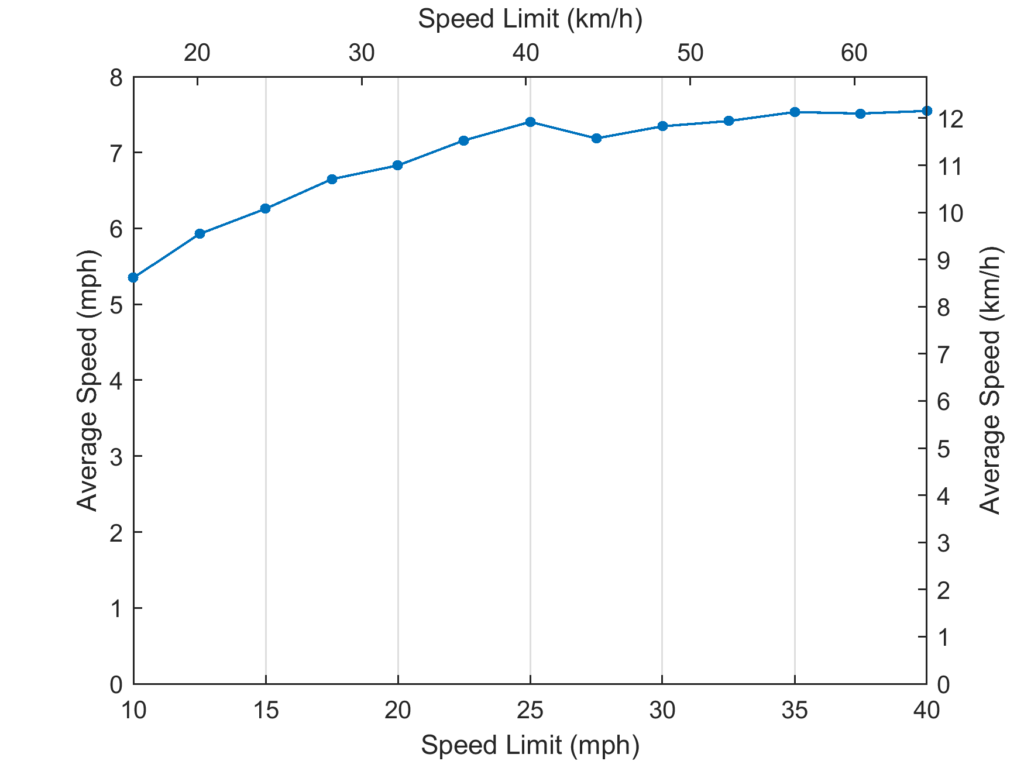
The effect on journey times were also modelled. The vehicles were timed driving in simulated traffic representative of conditions in London, UK, and their average speed calculated. The speed limit that vehicles observed was varied, and the effect on the average speed was measured. Because a significant proportion of the journey time is spent stationary in traffic, and because if every vehicle drives faster or slower, each vehicle still arrives in the same position in the queue at the next set of traffic lights, so effect of speed limit on journey time is minimal. The difference between everyone driving to a 30mph maximum speed and everyone driving to a 15mph maximum speed is about 1mph in difference in average speed.
The impact of driving style was also modelled, and it was found that driving in a conservative manner (lower acceleration and engine speed) only resulted in a 8.5% reduction in CO2 emissions and fuel efficiency relative to an aggressive style of driving at 30mph. This shows that reductions in speed limits are required to reduce emissions and improve air quality, rather than changes to driving style.
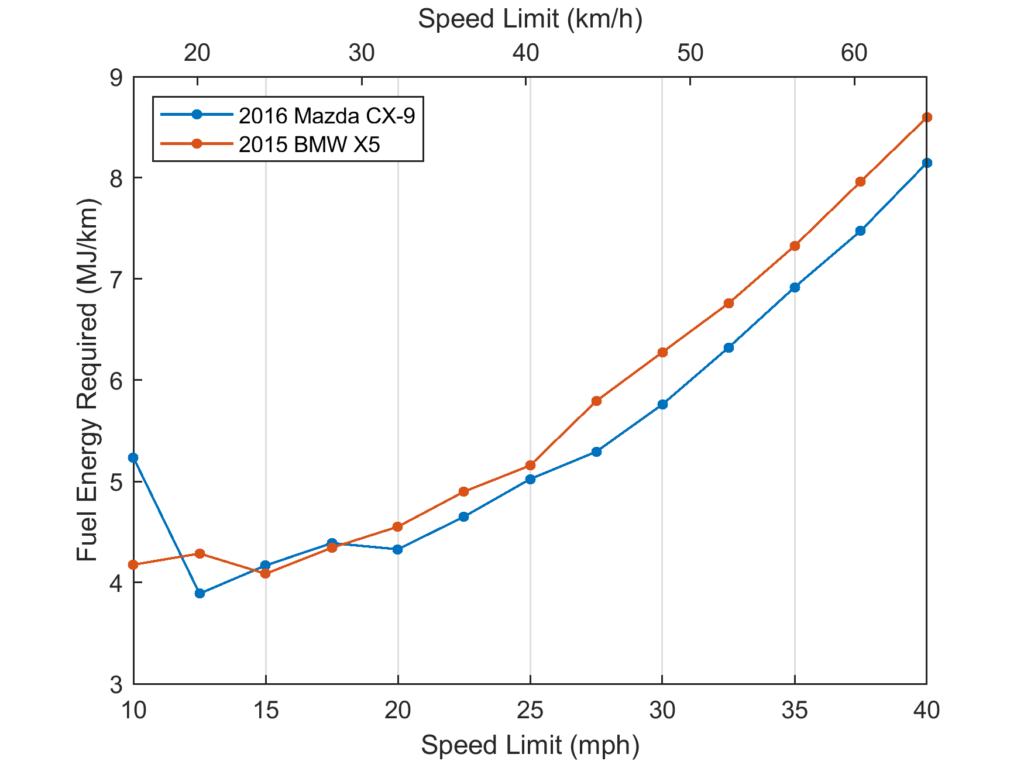
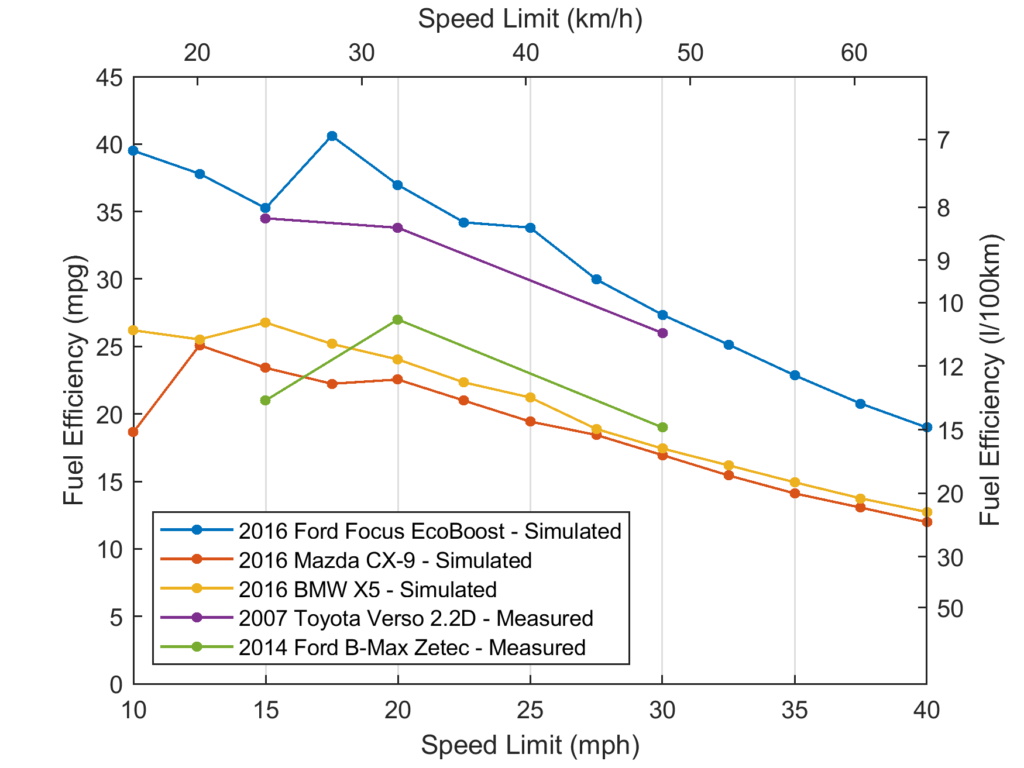
Increases in vehicle size also had an impact on emissions and fuel efficiency. Both emissions and fuel efficiency increased somewhat in proportion to the increase in mass between a hatchback and a SUV.
The empirical results from driving 2 test vehicles around a representative route at peak speeds of 15mph, 20mph and 30mph are included in the graph below. They match the results of the model quite closely, and validate the results found.
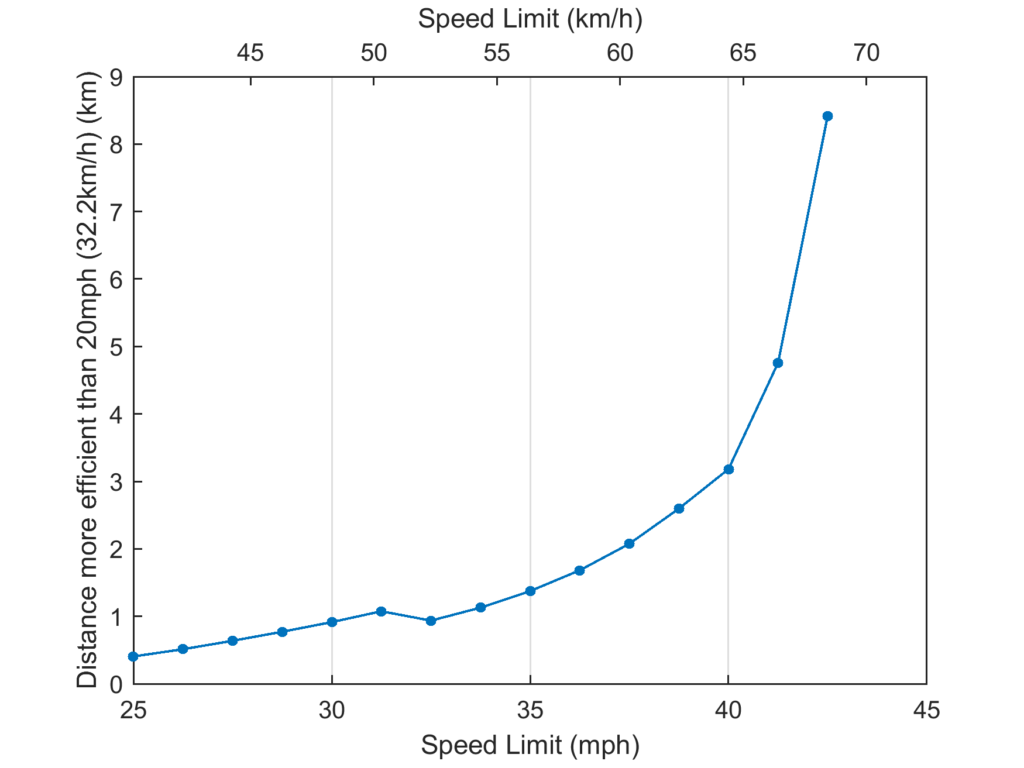
Many accepted historical references state that driving at higher speeds – typically 55mph (88.5km/h) – is more efficient. These references ignore the effect of decelerating and accelerating. To investigate this, simulations were run where the modelled vehicles accelerated up to a fixed speed, then maintained that steady speed indefinitely. The distance that the vehicle must travel in order for the improved efficiency at higher speeds to outweigh the extra energy required to accelerate up to that speed was calculated. The model was run for 3 different vehicles, Ford Focus EcoBoost petrol, representative of a small hatchback, a Mazda CX-9, representative of a petrol SUV, and BMX X5 3.0D, representative of a large diesel SUV.
For the Ford Focus EcoBoost it was found that some speeds above 20mph are more efficient than a cruising speed of 20mph, but only if the a given distance is travelled at these steady speeds without deceleration or acceleration. 30mph (48.3km/h) is more efficient than 20mph only if decelerations and accelerations are less frequent then every 0.91km. Any significant deceleration and acceleration more often than this will make 20mph more efficient. In dense cities and urban traffic, it is unlikely that a vehicle is able to travel at a steady speed over this distance, making 20mph almost always more efficient. This distance increases to 1.30km and 3.08km for the Mazda CX-9 and BMW X5 respectively.
Table. Travel distance required for different speed limits to result in a lower CO2/km emissions than a 20mph limit (32.2km/h).
| Speed limit | Ford Focus EcoBoost | Mazda CX-9 | BMW X5 |
| 22.5mph (36.2 km/h) | Never | Never | Never |
| 25 mph (40.2 km/h) | 0.41 km | Never | 0.91 km |
| 27.5 mph (44.3 km/h) | 0.64 km | 0.79 km | 1.82 km |
| 30 mph (48.3 km/h) | 0.91 km | 1.30 km | 3.08 km |
| 32.5 mph (52.3 km/h) | 0.94 km | 2.19 km | 2.00 km |
| 35 mph (56.3 km/h) | 1.37 km | 4.11 km | 3.26 km |
| 37.5 mph (60.4 km/h) | 2.07 km | 2.11 km | 6.28 km |
| 40 mph (64.4 km/h) | 3.18 km | 3.18 km | Never |
| 42.5 mph (68.4 km/h) | 8.42 km | 12.53km | Never |
| 45mph (72.4 km/h) | Never | Never | Never |
Model Summary
An innovative approach was used to model urban traffic. The simulation models the driving behaviour, speed, fuel consumption and emissions of vehicles in stop-start traffic that is typical of driving in London or a similar busy city. The aim of the simulation is to see the effects of accelerating to different maximum speeds in London style traffic, the impact of driving style and the differences due to vehicle size and type.
The question addressed is: If vehicles drive up to the speed limit whenever the road in front of them is clear, how does that speed limit effect their emissions, average speed and drive time? Some aspects of driving style have been modelled, these being different accelerations and engine speeds at which the driver switches gears. For simplicity, all drivers in any given simulation drive using the same style and all drive to the speed limit. In reality, not every driver will drive the same – not every driver will drive at the speed limit and some drivers will drive more aggressively than others.
The traffic was modelled as a queue of identical vehicles that crossed a series of traffic lights, which each represent hitting a junction, pedestrian crossing, vehicle in front turning or other obstruction or reason to slow down. The spacing of the traffic lights was set to 160m, and they were set to be red 70% of the time. This was based on Google Street view maps of a series of large London roads (A23, A2, A315, A219) and on driving round London in different traffic conditions during different times of the day and measuring the number of times per mile the traffic caused the vehicle to either stop or drop it’s speed below 10 mph. The average number of obstructions per mile driven was 7, equivalent to a period of deceleration and then acceleration every 230m, which is the same as an obstruction every 160m with a 70% chance of causing a deceleration. With this traffic model, the average speed of the vehicles in the model is around 7.0mph to 7.5mph, very close to the quoted 7.4mph average speed for London [4] (and also for New York). Note that accelerating from 10mph to 30mph requires 89% of the energy required to accelerate from 0mph to 30mph, so in terms of emissions, a drop to 10mph or lower is approximately the same as coming to a complete stop.
A queue of 100 vehicles was modelled driving the route. The 95th vehicle in the queue is assumed to be in fully developed traffic, and it is this vehicle which is analysed in further detail. The vehicles start from stationary and are then modelled to behave in the following ways:
- Slow to a complete stop at red lights
- Slow or continue at amber lights, depending on whether there is safe distance to stop
- Maintain a safe distance from the vehicle in front, and stopping if required
- Shift up to achieve the required torque when accelerating
- Shift up to maintain an efficient engine speed when travelling at a constant speed
- Shift down to maintain the correct gear when decelerating
We modelled 4 different vehicles, a petrol engine hatchback (Ford Focus EcoBoost), a diesel engine hatchback (Ford Focus TDCi), a petrol engine SUV (Mazda CX-9) and a diesel engine SUV (BMW X5). Due to availability of engine models and NOx emissions maps, CO2 emissions were modelled for the Ford Focus EcoBoost, Mazda CX-9 and BMW X5, whilst NOx emissions were only modelled for the Ford Focus TDCi.
Table. Key characteristics of the modelled vehicles [2] [3] [4] [5].
| Mass (kg) | Engine capacity (l) | Drag parameter (cdA) (m2) | |
| Ford Focus EcoBoost | 1250 | 1.499 | 0.70 |
| Ford Focus TDCi | 1268 | 1.499 | 0.70 |
| Mazda CX-9 | 1951 | 2.488 | 1.00 |
| BMW X5 | 2070 | 2.993 | 2.50 |
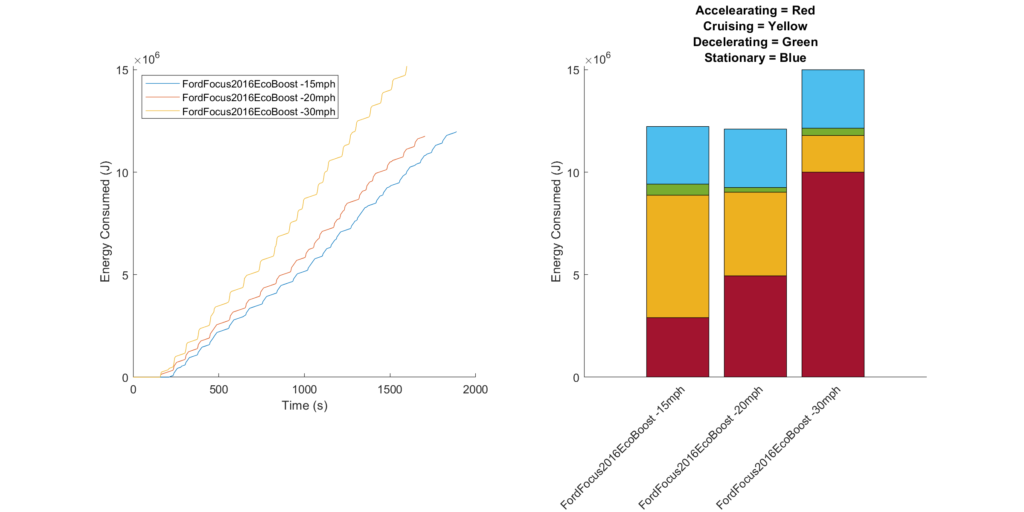
The simulation is repeated 50 times with different random traffic light phasing. For each vehicle, and for each step of the simulation, the speed and position are calculated based on defined driving characteristics. From this, the energy required to travel the previous calculated distance is calculated. The energy required is a combination of rolling and air resistances and force required to accelerate. The transmission of the vehicle is modelled, allowing the vehicle speed and energy required to move to be translated into a gear, engine speed and required torque. Using engine brake specific fuel consumption (BSFC) maps from the US Environmental Protection Agency (EPA) [6] [7] [8], the fuel consumption rate of the engine is determined from the engine speed and required torque. Fuel consumption and CO2 emissions can be calculated from this. NOx emissions are calculated from a similar engine map lookup created from real-world data. The simulations result in a breakdown of energy usage like that in figure below, which shows a higher contribution from the acceleration phase for higher speed limits.
The number of stop-starts is different for each simulation, due to the random phasing of the traffic lights. Transport for London (TfL) published data shows that the average speed in London traffic is 7.4mph (11.9km/h) [4]. The traffic light duty cycle was adjusted to give an average journey speed of 7.4mph with a 25mph (40.2km/h) speed limit. This was approximately 70%, resulting in an deceleration and acceleration on average every 230m, or 4 times per km driven.
The model runs over a distance of 4km, but the behaviour over the initial 640m (4 sets of traffic lights) is ignored. This is to allow the vehicles to reach a regular flow of traffic, removing the impact of the initial conditions.
The model was animated to show the interaction between maximum speed and queuing. Typically, vehicle progress is only intermittently affected by speed. Most of the time the vehicle is in the same place in the queue for the next set of lights. Only occasionally does a higher speed permit the vehicle to pass the next lights on green. A video of the simulation is available to view here: http://videos.futuretransport.info/cars_15_20_30_test_car96.mp4
A very important and suprising result from the analysis was that the major factor affecting the average journey time was the number of vehicles that pass through each green light cycle. The modelling showed that this is primarily a function of vehicle size and the gap between vehicles as they drive through the lights. If the vehicles are smaller, a larger number of them get through each green light. This results in a lower journey time and a faster average speed.
If everyone in London drove a golf buggy with a top speed of 15mph (24.1km/h), average speeds would be around 8.9mph (14.3km/h), compared to 7.4mph (11.9km/h) for full size vehicles doing 30mph, an improvement in journey times of over 20%. This can be seen in this simulation: http://videos.futuretransport.info/cars30_V_buggys15mph_RangeRovers.mp4
References
[1] Transport for London (TfL). 2018. TLRN Performance Report, Quarter 1 2017/2018. [online] Available at: https://content.tfl.gov.uk/tlrn-performance-report-q1-2017-18.pdf
[2] automobile-catalog. 2022. 2016 Ford Focus 1.5 EcoBoost (150) (man. 6) (Business, Titanium) (model for Europe) car specifications & performance data review. [online] Available at: https://www.automobile-catalog.com/car/2016/2082470/ford_focus_1_5_ecoboost_150.html
[3] automobile-catalog. 2022. 2016 Ford Focus 1.5 TDCi (120) (man. 6) (Trend, Business, Titanium) (model for Europe) car specifications & performance data review. [online] Available at: https://www.automobile-catalog.com/car/2016/2082560/ford_focus_1_5_tdci_120.html
[4] automobile-catalog. 2022. 2016 Mazda CX-9 Grand Touring AWD (aut. 6) (model since April 2016 for North America) car specifications & performance data review. [online] Available at: https://www.automobile-catalog.com/car/2016/2407130/mazda_cx-9_grand_touring_awd.html
[5] automobile-catalog. 2022. 2015 BMW X5 xDrive30d (aut. 8) (model for Europe) car specifications & performance data review. [online] Available at: https://www.automobile-catalog.com/car/2015/1902395/bmw_x5_xdrive30d.html
Full Paper
A more comprehensive discussion of this work can be found in the following report, which further details the model equations, validation, and results.